Strategy Tester Report
fx pro expert
AlpariUK-Demo (Build 226)
| Symbol | EURUSD (Euro vs US Dollar) | ||||
| Period | 1 Hour (H1) 2010.05.03 00:00 - 2010.05.31 00:00 (2010.05.01 - 2010.05.31) | ||||
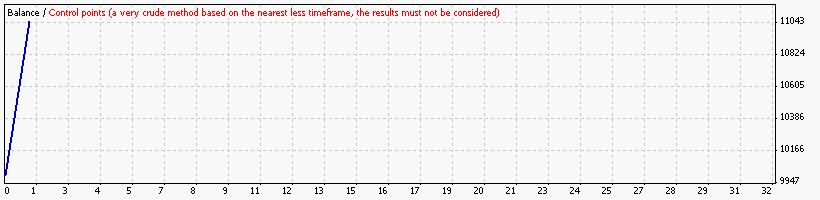
| Model | Control points (a very crude method, the results must not be considered) | ||||
| Parameters | MMType=1; UseClose=false; UseAdd=true; LotExponent=1.667; slip=3; Lots=0.1; LotsDigits=2; TakeProfit=7; PipStep=17; MaxTrades=10; UseEquityStop=false; TotalEquityRisk=20; UseTrailingStop=false; UseTimeOut=false; MaxTradeOpenHours=0; | ||||
| Bars in test | 1478 | Ticks modelled | 12947 | Modelling quality | n/a |
| Mismatched charts errors | 1 | ||||
| Initial deposit | 10000.00 | ||||
| Total net profit | 1054.11 | Gross profit | 1054.11 | Gross loss | 0.00 |
| Profit factor | Expected payoff | 1054.11 | |||
| Absolute drawdown | 3.50 | Maximal drawdown | 579.14 (5.36%) | Relative drawdown | 5.36% (579.14) |
| Total trades | 1 | Short positions (won %) | 1 (100.00%) | Long positions (won %) | 0 (0.00%) |
| Profit trades (% of total) | 1 (100.00%) | Loss trades (% of total) | 0 (0.00%) | ||
| Largest | profit trade | 1054.11 | loss trade | 0.00 | |
| Average | profit trade | 1054.11 | loss trade | 0.00 | |
| Maximum | consecutive wins (profit in money) | 1 (1054.11) | consecutive losses (loss in money) | 0 (0.00) | |
| Maximal | consecutive profit (count of wins) | 1054.11 (1) | consecutive loss (count of losses) | 0.00 (0) | |
| Average | consecutive wins | 1 | consecutive losses | 0 | |
| # | Time | Type | Order | Size | Price | S / L | T / P | Profit | Balance |
| 1 | 2010.05.03 00:00 | sell | 1 | 0.10 | 1.33296 | 0.00000 | 0.00000 | ||
| 2 | 2010.05.28 22:59 | close at stop | 1 | 0.10 | 1.22709 | 0.00000 | 0.00000 | 1054.11 | 11054.11 |